

The U.S. economy enters the final quarter of 2026 with a mix of resilience and concentration that is easy to miss in the headline numbers. Real GDP grew at a 2.2% annualised rate in Q2 2026, unemployment was 4.2% in September, and the Federal Reserve's preferred inflation measure was still running at 3.4% year-on-year in August. At the same time, the federal deficit was approaching $2 trillion for the first 11 months of fiscal 2026, while the S&P 500 had gained about 12.8% year-to-date by 2 October.
On the surface, this looks like a reasonably strong economy and a strong stock market. But there is an important distinction between the health of the aggregate economy and the performance of the assets investors see in major equity indices.
U.S. growth is broad geographically, but U.S. equity-market performance is increasingly concentrated in a small number of very large companies. That distinction matters for anyone trying to understand what the headline numbers actually say about the economy, corporate America and portfolio risk.

Photo: New York Stock Exchange, Wall Street. Ad Meskens, Wikimedia Commons, CC BY-SA 3.0. Image source and licence.
The U.S. economy at a glance
| Indicator | Latest | Period |
|---|---|---|
| Real GDP growth | 2.2% | Q2 2026, annualised |
| Unemployment | 4.2% | September 2026 |
| PCE inflation | 3.4% | August 2026, YoY |
| Core PCE inflation | 3.0% | August 2026, YoY |
| Federal deficit | $2.0tn | First 11 months of FY2026 |
| S&P 500 | 7,722.72 | Close, 2 October 2026 |
Sources: U.S. Bureau of Economic Analysis, U.S. Bureau of Labor Statistics, Congressional Budget Office and Associated Press market data. GDP: BEA. Employment: BLS. Inflation: BEA PCE. Deficit: CBO. S&P 500 close: AP.
Growth is still positive
Real GDP increased at a 2.2% annualised rate in Q2 2026, according to the BEA's third estimate. That followed revised growth of 2.5% in Q1. The latest estimate was notably stronger than the previous 1.5% estimate for Q2, with consumer spending, investment and exports contributing to growth. BEA, 30 September 2026.
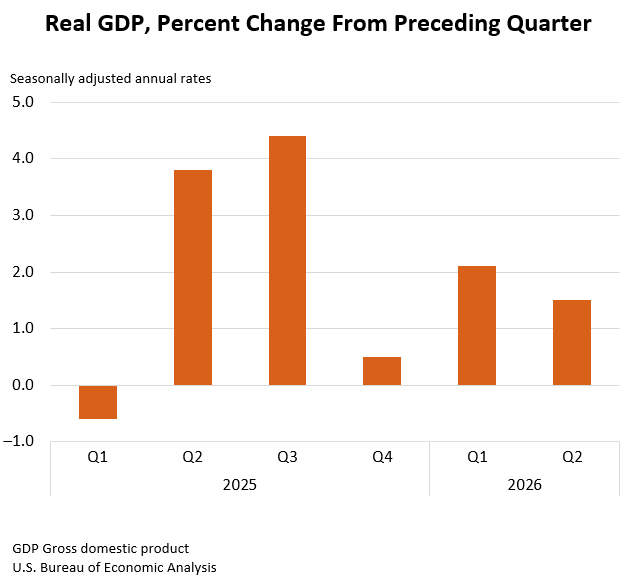
Real GDP, percentage change from preceding quarter. Source: U.S. Bureau of Economic Analysis, Q2 2026 GDP release. Source.
One useful feature of the current expansion is that it is not simply a government-spending story. The BEA says consumer spending, investment and exports contributed to the Q2 increase, while government value added was essentially flat. Business investment in equipment and intellectual-property products has remained an important part of the picture.
The labour market has cooled, but not collapsed
The September employment report showed an unemployment rate of 4.2%. Nonfarm payroll employment increased by only 29,000 during the month, and employment changed little across the major industry groups. U.S. Bureau of Labor Statistics, 2 October 2026.
Unemployment: 4.2%
September 2026
Payroll employment: +29,000 for the month
The distinction is important. A 4.2% unemployment rate is not evidence of a weak labour market by itself, but the very modest monthly payroll increase suggests that labour demand has lost momentum. The economy can therefore continue expanding while the employment side becomes less dynamic.
Inflation is lower, but not back to target
The PCE price index increased 3.4% year-on-year in August, while core PCE increased 3.0%. The Federal Reserve's inflation objective is 2%, making the remaining gap material for monetary policy. BEA, August 2026 Personal Income and Outlays.
Inflation snapshot, August 2026
PCE 3.4%
Core PCE 3.0%
Fed target 2.0%
Source: U.S. Bureau of Economic Analysis; Federal Reserve 2% inflation objective.
The inflation story is therefore one of incomplete normalisation. Inflation is far below its post-pandemic peak, but the last stage of the journey back to 2% is proving more difficult. For investors, that matters because inflation affects interest rates, discount rates, real returns and the relative valuation of equities and bonds.
The fiscal deficit remains very large
The federal fiscal position is another defining feature of the current environment. The Congressional Budget Office estimated that the federal budget deficit reached approximately $2.0 trillion during the first 11 months of fiscal year 2026. In July, CBO projected a full-year FY2026 deficit of approximately $2.1 trillion. CBO, September 2026; CBO, August 2026.
FY2026 deficit through 11 months
CBO full-year FY2026 estimate
A large deficit can support demand in the near term, but it also means the Treasury must continue financing substantial borrowing. The interaction between fiscal policy, long-term Treasury yields and inflation is therefore increasingly important for investors.
The S&P 500 has performed strongly
The S&P 500 closed at 7,722.72 on 2 October 2026. According to Associated Press market data, the index was up approximately 12.8% year-to-date. Associated Press, 2 October 2026.
S&P 500
7,722.72
+12.8% YTD
2 October 2026
That performance might suggest that corporate America is broadly thriving. The structure of the index tells a more nuanced story.
The market is much more concentrated than the headline index suggests
The S&P 500 is market-cap weighted, so the largest companies have a disproportionate influence on the index. As of 31 August 2026, information technology alone represented 37.9% of the index. S&P Dow Jones Indices' constituent data also show the extraordinary weight carried by the biggest companies. S&P Dow Jones Indices.
S&P 500 concentration
Information Technology 37.9%
Top 10 constituents ~38%
Sector weight as of 31 August 2026. Top-10 concentration based on S&P Dow Jones Indices constituent-weight data.
This concentration changes how the S&P 500 should be interpreted. When a small group of enormous companies rises sharply, the index can continue making gains even when the average listed company is performing much less strongly.
That is particularly relevant during the current AI investment cycle. Nvidia, Microsoft, Apple, Amazon, Alphabet, Broadcom, Meta and other mega-cap companies have substantial weights in the index and significant exposure to the build-out and monetisation of artificial intelligence. The index therefore contains a considerable amount of common technology and AI-related exposure.
The economy is broader than the stock market
There is an important correction to the idea that U.S. growth is occurring only in a few states. The latest BEA data show that real GDP increased in 44 states and the District of Columbia in Q2 2026. Growth ranged from +4.0% in New York to -2.3% in West Virginia. BEA GDP by State.
States with GDP growth in Q2
Highest: New York
Lowest: West Virginia
So the better argument is not that only a handful of states are growing. It is that growth varies substantially by industry and geography, while the public equity market is even more concentrated in a small group of companies.
Why this concentration matters for investors
The distinction between economic breadth and market breadth creates several implications.
1. The S&P 500 is not the U.S. economy
The index contains large global corporations. A multinational technology company can derive substantial revenue outside the United States, meaning its share price is influenced by global demand, currencies, overseas regulation and international capital spending.
2. A few companies can dominate portfolio outcomes
Broad-market ETFs can look highly diversified by security count while still being heavily dependent on a small set of mega-cap businesses. The number of holdings is therefore a poor substitute for concentration analysis.
3. AI investment can amplify both upside and downside
AI-related capital expenditure has become an important source of investment demand. If AI spending converts into durable revenue and productivity improvements, the largest beneficiaries can continue to capture significant economic value. If expectations or spending weaken, the same concentration can work in reverse.
4. Equal-weight and small-cap comparisons matter
Comparing a market-cap-weighted index with equal-weighted or smaller-cap benchmarks can provide a different picture of market breadth. The question is not which index is "right", but what each one is measuring.
What investors should watch next
- GDP composition: whether consumption, investment and exports continue to broaden or become increasingly dependent on a small set of industries.
- Employment: whether the current 4.2% unemployment rate remains stable as hiring slows.
- Inflation: whether PCE inflation can move closer to 2% without a material deterioration in growth or employment.
- Fiscal borrowing: how persistent deficits interact with Treasury issuance and long-term yields.
- Market breadth: whether performance continues to be led by a narrow group of mega-cap companies or becomes broader.
- AI economics: whether the enormous capital being spent on AI infrastructure ultimately produces corresponding revenue, profit and cash-flow growth.
Conclusion
The U.S. economy in late 2026 is still growing, with real GDP expanding at a 2.2% annualised rate in Q2 and unemployment at 4.2%. Inflation, however, remains above the Federal Reserve's 2% objective, and the federal government continues to run a very large deficit.
The more interesting story is underneath those headline figures.
The U.S. economy is relatively broad, but the U.S. stock market is increasingly concentrated. Forty-four states and the District of Columbia recorded GDP growth in Q2, yet the S&P 500 remains heavily weighted towards a small group of mega-cap companies and a technology sector that represented 37.9% of the index at the end of August.
That means a strong S&P 500 does not necessarily imply equally strong performance across the wider corporate economy. For investors, understanding that distinction is essential. The next phase of the cycle will depend not only on whether the U.S. continues to grow, but on how broadly that growth is distributed and how much of the market's performance remains dependent on a handful of companies.
Sources
U.S. Bureau of Economic Analysis: Q2 2026 GDP and State GDP
U.S. Bureau of Labor Statistics: Employment Situation, September 2026
U.S. Bureau of Economic Analysis: Personal Income and Outlays, August 2026
Congressional Budget Office: Monthly Budget Review, August 2026
S&P Dow Jones Indices: S&P 500
Associated Press: U.S. market close, 2 October 2026

.svg)
.png?width=500&name=Blog%20banners%20(8).png)
Comments